

In short
- You can check website speed for free in PageSpeed Insights, preferably in the mobile view.
- Core Web Vitals are three indicators: LCP up to 2.5 s, INP up to 200 ms and CLS up to 0.1 count as good (75th percentile of visits).
- Field data shows real users, lab data is for finding causes. They may differ.
- Start with images, plugins and external scripts, and only then consider changing your hosting.
Table of contents (7)
You can check your website's speed for free in Google's PageSpeed Insights tool. You paste the address, and within a dozen or so seconds you get a score and a list of problems. Three indicators count, the so-called Core Web Vitals: LCP (how quickly the main content appears), INP (how quickly the page responds to a click) and CLS (whether anything jumps around while loading). The most common causes of a slow website are images that are too heavy, too many plugins and scripts, and weak hosting.
Why a slow website costs you clients
A client on a phone does not wait. If after clicking a Google result they see a blank screen, they go back to the results and visit a competitor. Nobody counts this in your analytics as "lost sales", but it happens.
Core Web Vitals are the indicators Google itself uses to describe how comfortable a website is to use, so it is worth knowing them and keeping an eye on them. They will not replace good content, but they show whether the website makes the client's life harder. I write about this more broadly in the text on how to build a website that generates enquiries.
Working with small businesses, I often see the same picture. The website looks nice on the designer's computer, and on the client's older phone it takes ages to load. That is why we start with measurement, not with guessing.
Core Web Vitals in plain language
Google assesses a website with three indicators. The thresholds below come from the web.dev documentation and refer to the 75th percentile of visits, that is, the result achieved by most (three quarters) of visitors.
- LCP (Largest Contentful Paint): the time after which the largest element of the page is visible, usually the main photo or a large heading. A good result is 2.5 s or less, a poor one is above 4 s (source).
- INP (Interaction to Next Paint): how long the page "thinks" after a click, a tap or a key press. A good result is 200 ms or less, a poor one is above 500 ms (source). INP replaced the earlier indicator FID.
- CLS (Cumulative Layout Shift): how many elements shift unexpectedly. A good result is 0.1 or less, a poor one is above 0.25 (source).
| Indicator | What it measures | Good | Needs improvement | Poor |
|---|---|---|---|---|
| LCP | the main content appearing | up to 2.5 s | 2.5 to 4 s | above 4 s |
| INP | response to a click | up to 200 ms | 200 to 500 ms | above 500 ms |
| CLS | layout stability | up to 0.1 | 0.1 to 0.25 | above 0.25 |

From practice: CLS is easy to notice with the naked eye. You want to click "Call", and at that moment a banner loads above the button and you hit something else. The usual culprits are images without set dimensions or a cookie window that pops up late.
How to check website speed step by step
- Go to Google's PageSpeed Insights and paste the address of your home page.
- Wait for the result and switch the view to mobile, because most clients of local businesses visit from a phone.
- Check the important subpages separately: the offer, the contact page, the page you send ad traffic to.
- Save the results before making changes, so you can see the difference after the fixes.
Do not trust a single measurement. The result can fluctuate, so do two or three runs.
Three simple questions help when reading the report. Are the field indicators in the green range? If so, there is nothing urgent. Which of the three indicators stands out? That points the direction for the fixes. Does the list of lab recommendations match what you see with the naked eye on a phone? If so, you have a concrete plan; if not, look for the cause in what happens only after the click.
Field data versus lab data
This is the most common misunderstanding. PageSpeed Insights shows two kinds of data (Google documentation):
- Field data: anonymous measurements of real Chrome users, collected in the CrUX report. These show how the website really works.
- Lab data: a simulation carried out by the Lighthouse tool in controlled conditions. It is good for finding causes, but may not reflect real problems.
Both values cover the last 28 days. If the website has few visits, there may be no field data at all. In that case rely on the lab and test each following change.
The field result tells you how things really are. The lab result helps find the specific culprit. A discrepancy between them is not an error, because they measure different things.
The most common causes of a slow website
From my experience in small businesses, a few things keep recurring.
Images. A photo straight from a camera or phone put on the website without being reduced is a classic. Often it is enough to change the size and the format to a modern one (WebP or AVIF) and to switch on loading images only when scrolling. The photo at the very top of the page (it is usually the LCP) should not, however, be loaded with a delay.
Plugins and add-ons. Each adds code. A page builder, a slider, animations, five form plugins. Remove what you do not use, and merge similar features into one.
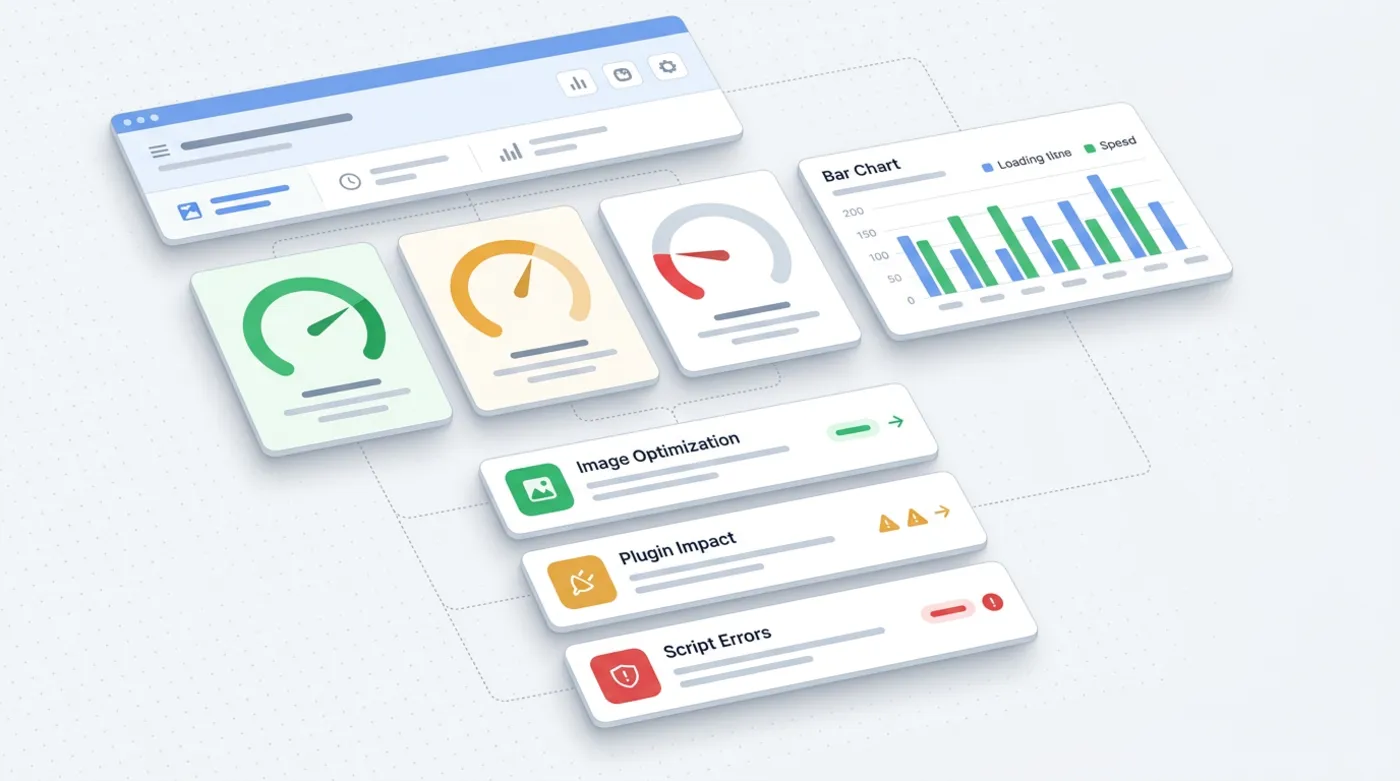
External scripts. Chat, advertising pixels, maps, videos embedded at the start, analytics tools. Each is an extra request to someone else's server. A control question: does this script really bring me clients? If you cannot answer, switch it off as a trial and measure the website again.
Elements loaded straight away. A background video, a carousel with ten photos, several fonts from external servers. It looks impressive, but it delays the content appearing. Often one good photo and one font are enough.
Hosting. A cheap, overloaded server responds slowly, and no optimisation will make up for it. The symptom is a long wait for the server's first response.
No cache. A page generated from scratch at every visit burdens the server. A good cache configuration can improve this a lot.
From practice: Do not start by buying more expensive hosting. First reduce the images and clear out the plugins. This often gives the biggest effect at the smallest cost.
What to fix first
The order matters. Go from the things that give the most for the least effort.
- Reduce and convert the images, especially the photo at the top of the page.
- Set image dimensions and room for banners so that nothing jumps (CLS).
- Remove unused plugins and external scripts.
- Switch on cache and check whether the hosting is the bottleneck.
- Measure again and compare with the saved result.
Sometimes the problem lies deeper, in the very construction of the website. A ready-made theme with a page builder that loads hundreds of kilobytes of code is hard to slim down. Then it is worth considering a different approach. I write about the differences in the text WordPress or React, and about costs in the post how much a website costs.
Remember that a score of 100 points is not a goal in itself. What counts is that the client quickly sees what they came for and can click without trouble. Green Core Web Vitals in the field data are a sensible goal. After each fix, measure again, because sometimes one change spoils another, for example compression that is too strong spoils the quality of photos, and a new cache plugin clashes with the form.
Where to start
- Today, paste your website address into PageSpeed Insights and save the results for mobile.
- See which of the indicators (LCP, INP, CLS) is outside the green range.
- Start with images and plugins, which is usually the quickest improvement.
- After the changes, measure the website again after a few days.
- If the result is still poor, or you do not know what the recommendations mean, ask for a review.
I build and improve websites for small businesses, including for speed. If you want me to look at your website and tell you what is really worth fixing, write to me. No obligation.
Frequently asked questions
What are good Core Web Vitals values?
According to web.dev, a good result is LCP up to 2.5 s, INP up to 200 ms and CLS up to 0.1. The 75th percentile of visits is assessed, separately for phones and computers.
Why does PageSpeed Insights show two different results?
One is field data, that is, measurements of real Chrome users (CrUX). The other is a laboratory simulation by Lighthouse. They measure different things, so they may differ.
What most often slows down a small business website?
Usually images that are too large, too many plugins and external scripts, no cache and weak hosting. Start with images and plugins.
Is a score of 100 points necessary?
No. What matters more is that the Core Web Vitals in the field data fall within the good range, and that the client quickly sees the content and can click.
Why do I have no field data?
Field data comes from the CrUX report and requires a sufficient number of visits. With little traffic it may not appear, and then you should rely on the lab data.
Sources

Author
Piotr Babczyński
I help businesses win customers online: SEO, Google and Meta ads, automation and AI. I work from Szczecin, Poland, and remotely. I write about what I test on real projects.
- 30 years in IT
- SEO and Google Ads
- AI implementation
- #website speed
- #Core Web Vitals
- #PageSpeed
- #optimisation